Documentation Index
Fetch the complete documentation index at: https://docs.xquiz.com.br/llms.txt
Use this file to discover all available pages before exploring further.
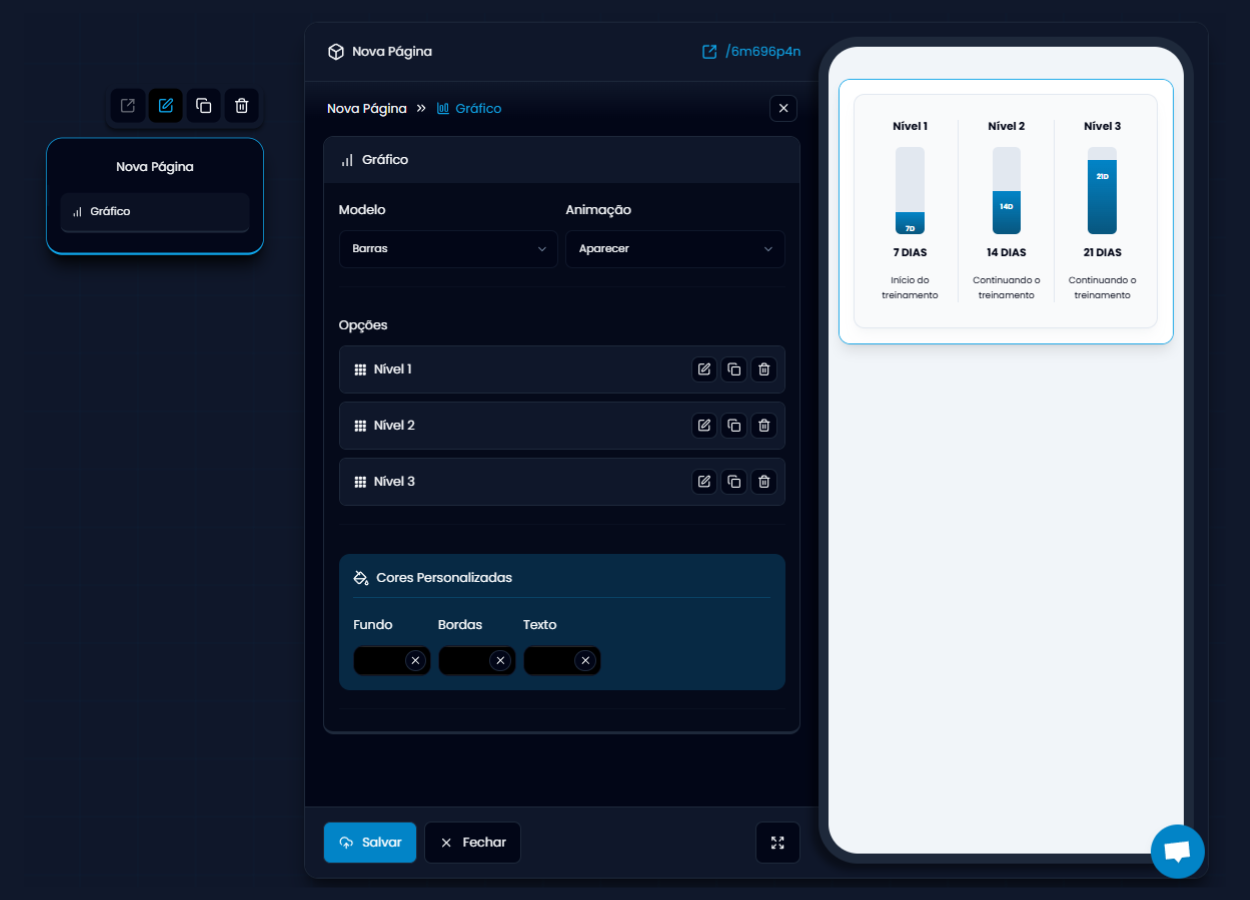 The Graph element allows you to present information in a visual and comparative way, making it easier to read data such as progress, performance, levels, or categories. It’s ideal for result or diagnosis pages that need to convey clarity and impact.
What it’s for
The Graph element allows you to present information in a visual and comparative way, making it easier to read data such as progress, performance, levels, or categories. It’s ideal for result or diagnosis pages that need to convey clarity and impact.
What it’s for
-
Compare evaluation levels or categories (e.g., Level 1, 2, 3).
-
Show evolution or progress.
-
Make data easier to interpret and more visually attractive.
Available templates:
Bars: vertical bars with dynamic filling.
What you can configure
Options (each comparison item):
-
Title and Subtitle.
-
Score (value that defines bar filling).
-
Label (text above the bar).
-
Description (text below the bar).
Animation:
- Choose the visual entry type (e.g., appear).
Custom colors:
Customize background, border, bar, and text colors.
Usage tip!
This element is excellent for showing progress stages (e.g., “Beginner”, “Intermediate”, and “Advanced”) or for representing visual results in diagnoses. It conveys organization, professionalism, and facilitates decision-making for those viewing the result.