Documentation Index
Fetch the complete documentation index at: https://docs.xquiz.com.br/llms.txt
Use this file to discover all available pages before exploring further.
- Show the evolution of values throughout stages.
- Represent user score or performance.
- Compare visual data series in diagnoses or tests.
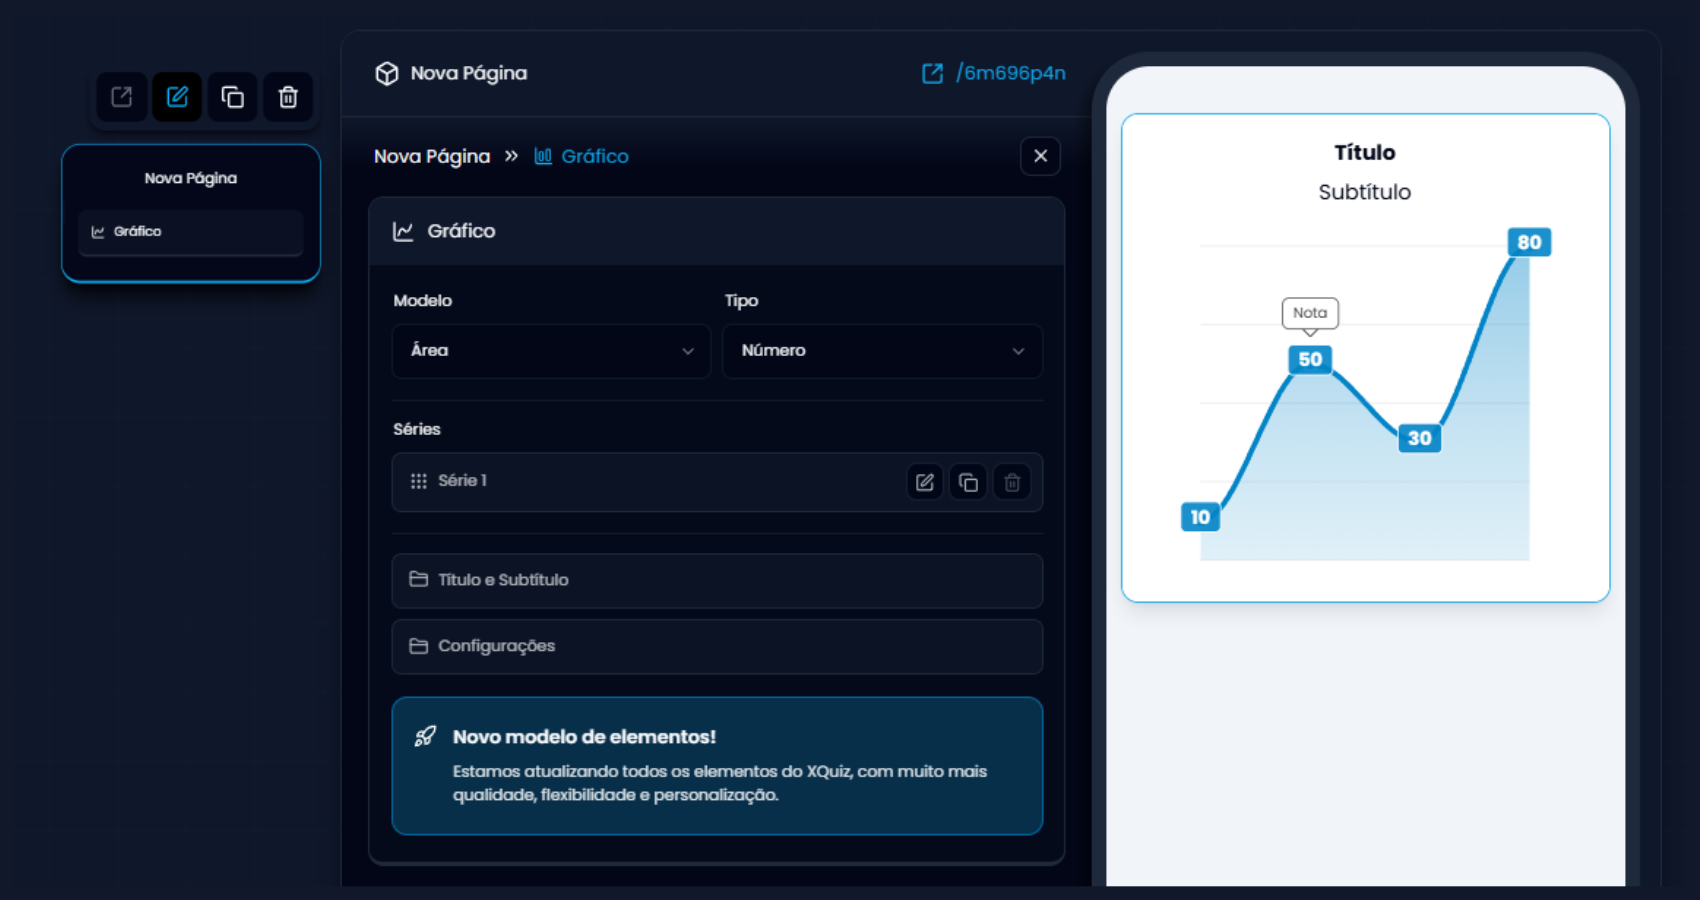
- Series title (e.g., “Final score”).
- Numerical values that will be represented.
- Value note: a small explanatory text that appears over the values.
- Label: activates or deactivates the display of numbers over points.
- Template: area (you can also choose other templates like line).
- Type: defines the number format (e.g., simple number, percentage, dollar, real, or weight).
- Choose how the graph will appear on the page (e.g., appear).