Documentation Index
Fetch the complete documentation index at: https://docs.xquiz.com.br/llms.txt
Use this file to discover all available pages before exploring further.
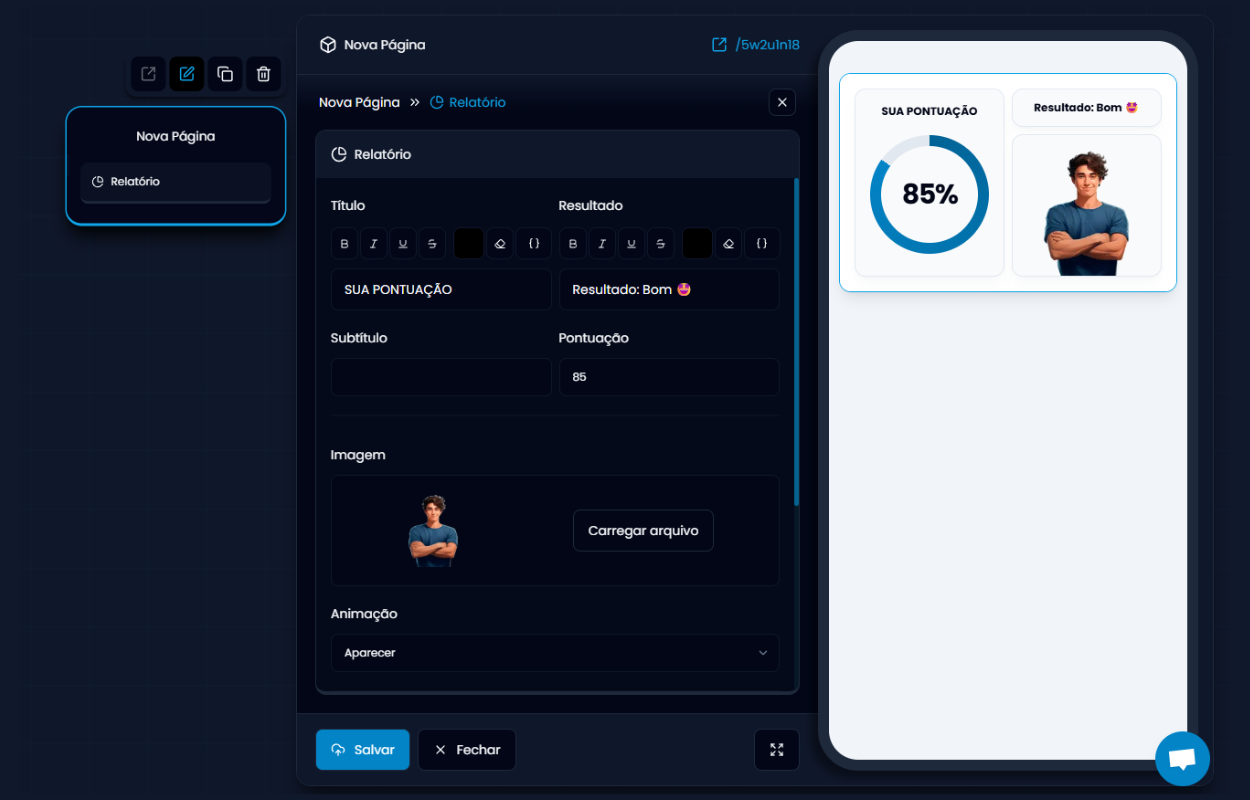 The Report element is ideal for showing the final result of the quiz or test in a visual, clear, and impactful way.
It combines title, numerical score, personalized message, and image, helping to reinforce the perception of value and professionalism of your result page.
The element displays an animated circular chart with the percentage of the defined score. This chart is automatically generated based on the value entered in the “Score” field.
What it’s for
The Report element is ideal for showing the final result of the quiz or test in a visual, clear, and impactful way.
It combines title, numerical score, personalized message, and image, helping to reinforce the perception of value and professionalism of your result page.
The element displays an animated circular chart with the percentage of the defined score. This chart is automatically generated based on the value entered in the “Score” field.
What it’s for
-
Display the user’s final score with emphasis.
-
Show an image related to the result.
-
Personalize the message based on the score obtained.
-
Reinforce the feeling of achievement or direct to next steps.
What you can configure
Content:
-
Title: the main title of the result (e.g., “Your score”).
-
Result: text that appears next to the image (e.g., “Result: Excellent”).
-
Subtitle (optional): you can include a complementary phrase.
-
Score: final numerical value of the user (e.g., 85).
Image:
- You can upload an image to accompany the result (e.g., character, medal, approval seal).
Animation:
- Define how the element appears on screen (e.g., “appear”).
Custom colors:
-
Background, borders, text.
-
Chart color (start and end).
Usage tip!
Use this element at the end of the quiz or test to generate visual impact and reinforce the achieved result. Combine with a call-to-action button (e.g., “I want to learn more” or “Download my personalized plan”) to guide the next step.
If you want to make it more motivational, personalize the result message with emojis and a captivating image to create connection with the audience.