Documentation Index
Fetch the complete documentation index at: https://docs.xquiz.com.br/llms.txt
Use this file to discover all available pages before exploring further.
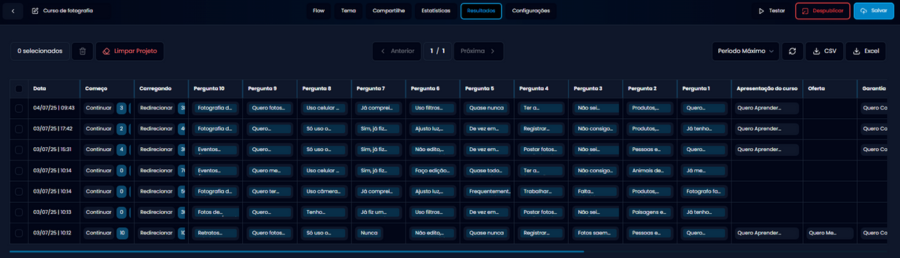 The Results tab shows a complete and detailed view of all responses collected in your quiz, organized by each page of your flow. This is one of the most important areas of the platform, as it allows you to track each lead’s journey, understand behaviors, and evaluate your funnel’s performance.
What do you find on this screen?
Columns with page names
Each column in the table represents a page created in your project. That is, XQuiz uses the names of your flow pages as column titles.
Examples:
The Results tab shows a complete and detailed view of all responses collected in your quiz, organized by each page of your flow. This is one of the most important areas of the platform, as it allows you to track each lead’s journey, understand behaviors, and evaluate your funnel’s performance.
What do you find on this screen?
Columns with page names
Each column in the table represents a page created in your project. That is, XQuiz uses the names of your flow pages as column titles.
Examples:
-
Start, Loading – can be initial or transition pages.
-
Question 1, Question 2… – pages with questions.
-
Course Presentation, Offer, Guarantee – offer, presentation, or closing pages.
These names are the ones you defined when creating your pages in the flow, so you can customize them however you want to make the reports clearer.
Date
- The first column shows the date and time when each person started the quiz.
Each row is a lead
Each row represents the journey of a person who answered the quiz. The table shows:
-
The path they took (which pages they answered);
-
The responses given at each stage;
-
Whether they reached the offer or not;
-
Whether they clicked action buttons (like “buy”, “guarantee”, etc.).
Data export
You can export all results in two formats:
Just click the buttons at the top of the table. This makes it much easier if you want to:
-
Do deeper analysis;
-
Integrate with spreadsheets;
-
Import to your CRM or automation tool.
Filters and pagination
-
Use the period filter to see results from a specific date.
-
Navigate between result pages with the “Previous” / “Next” buttons.
What is this function for?
-
Track the progression rate between quiz pages;
-
Understand what leads are responding;
-
Identify dropout points;
-
See who clicked on the offer;
-
Export everything to analyze in Excel, Google Sheets, etc.
Give strategic and descriptive names to your flow pages! This makes reading reports easier and helps make faster decisions.