Documentation Index
Fetch the complete documentation index at: https://docs.xquiz.com.br/llms.txt
Use this file to discover all available pages before exploring further.
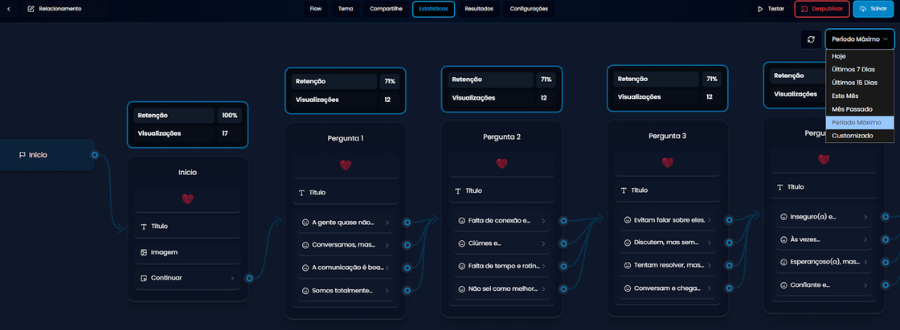 The Statistics tab in XQuiz allows you to track, in real-time, how people are interacting with each part of your quiz. This view is essential for understanding where users are dropping off, which questions have more retention, and how overall engagement is performing.
What do you see in the panel?
Each page shows two indicators:
The Statistics tab in XQuiz allows you to track, in real-time, how people are interacting with each part of your quiz. This view is essential for understanding where users are dropping off, which questions have more retention, and how overall engagement is performing.
What do you see in the panel?
Each page shows two indicators:
- Retention: percentage of people who reached that point in the funnel.
Ex: If 100 people started and 80 reached Question 2, the retention there will be 80%.
- Views: total number of times that specific block was displayed.
This data helps identify bottlenecks in the funnel, that is, points where users are giving up or losing interest.
Period filter
In the upper right corner, there’s a dropdown menu where you can select the analysis period. The options include:
-
Today.
-
Last 7 Days.
-
Last 15 Days.
-
This Month.
-
Last Month.
-
Maximum Period.
-
Custom.
This allows you to analyze your quiz performance dynamically and comparatively, ideal for seeing the effects of a campaign, layout change, or new promotion.
Why is this useful?
With this data you can:
-
See where people are abandoning the quiz.
-
Test improvements (such as changing images, texts, or questions).
-
Make more strategic decisions to increase conversion and engagement.